PLUME MONITORING & DREDGING

PLUME MONITORING & DREDGING

PAYLOAD:
RBRmaestro CTD
Seabird/WETlabs ECOpuck: ChlA, backscatter, phycoerythrin
INSTITUTION:
Scripps Institution of Oceanography
DEPLOYMENT LOCATION:
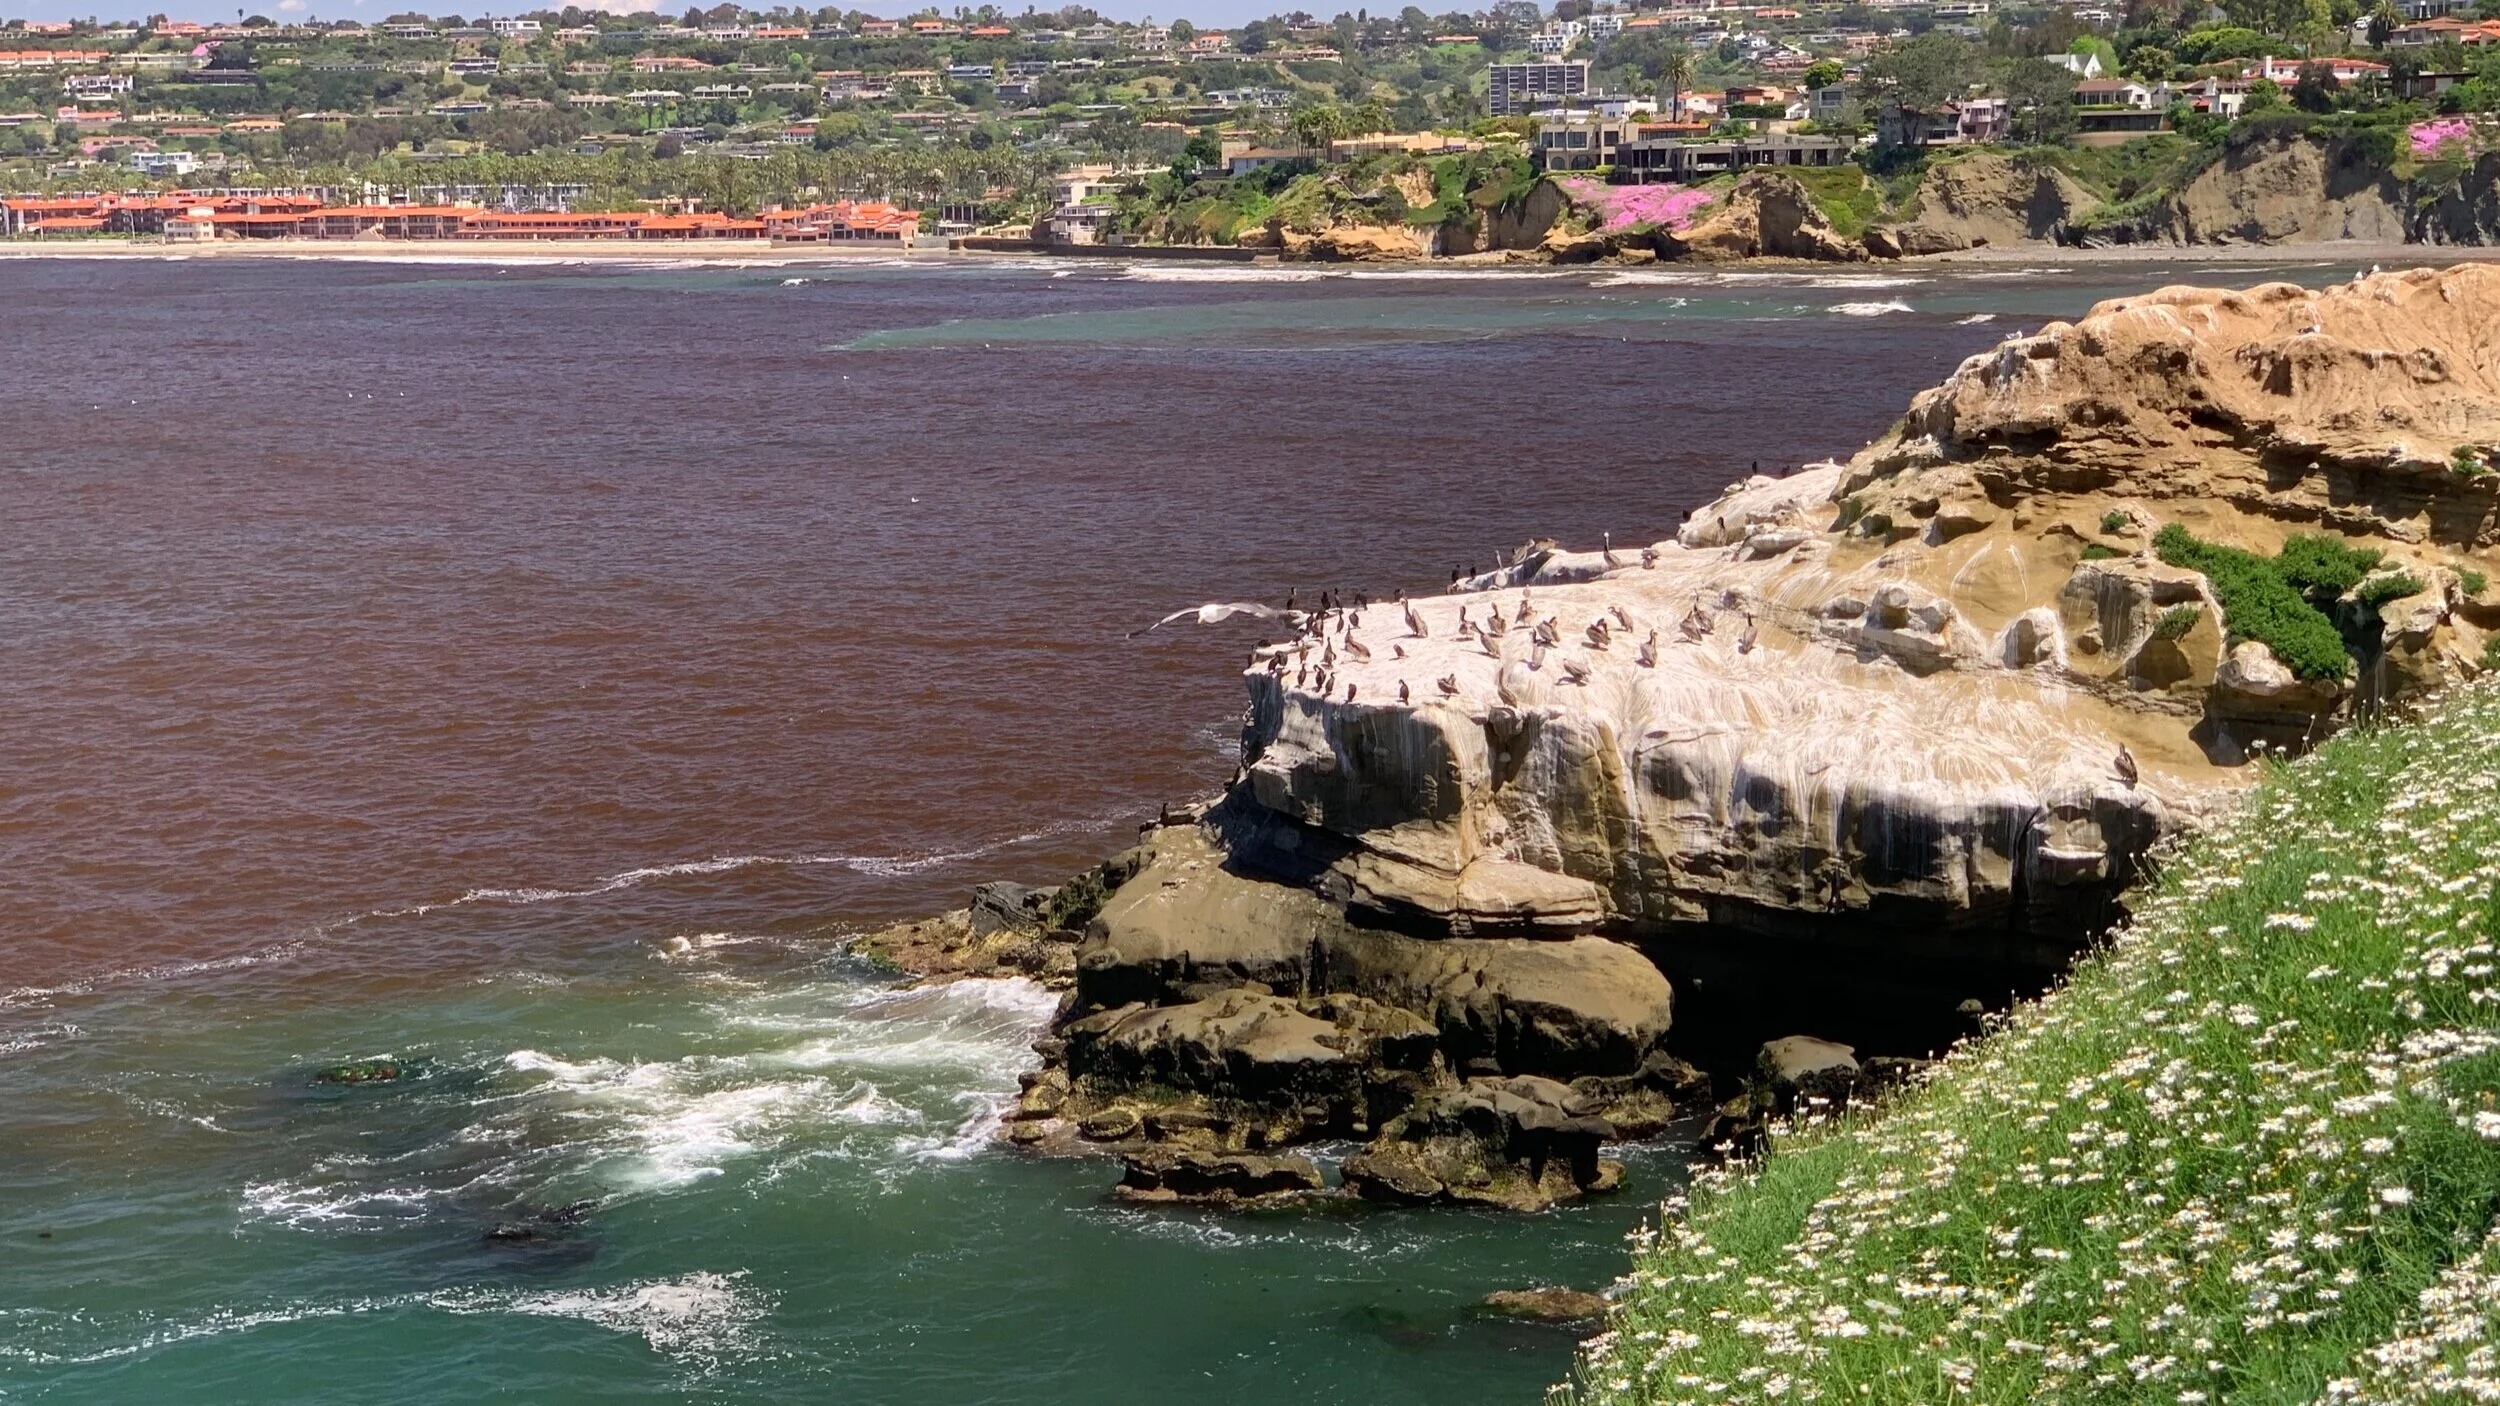
La Jolla Canyon, La Jolla California, USA
SCIENTIFIC SUMMARY:
The Wirewalker’s high temporal and spatial resolution while profiling the water column, and ability to transmit the data in real-time, provides the perfect tool for plume monitoring, whether from water plumes (eg industrial effluents, city discharges, current jets, etc) or sediment plumes (eg resuspension, dredging, etc).
The example below (Figure 1) presents a 48-hour period from a 100m Wirewalker deployment near La Jolla, California. Plotted are temperature and backscatter profiles showing the breaking of internal waves and stirring of sediment off the bottom to more than 50m high (the first wave is clearly seen in both plots between hrs 2-4). During hours 12 to 36, there was a storm event, resulting in strong rain and waves. This led to rain runoff being mixed down to 50m deep (as visible in the backscatter profiles during that time). Finally, the second internal wave can be seen breaking between hours 26-28; mixing sediments up to 70m from the bottom, and producing a sediment plume that persists throughout the rest of the record.
Figure 1 - 48-hour period of temperature and backscatter profiles.
REFERENCE:
Alberty, M. S., Billheimer, S., Hamann, M. M., Ou, C. Y., Tamsitt, V., Lucas, A. J., and Alford, M. H. ( 2017), A reflecting, steepening, and breaking internal tide in a submarine canyon, J. Geophys. Res. Oceans, 122, 6872–6882, doi:10.1002/2016JC012583.